
Create a Report with Looker Studio
- Go to https://lookerstudio.google.com/ and log in with your Google account, if needed.
-
In the top left corner, go to .
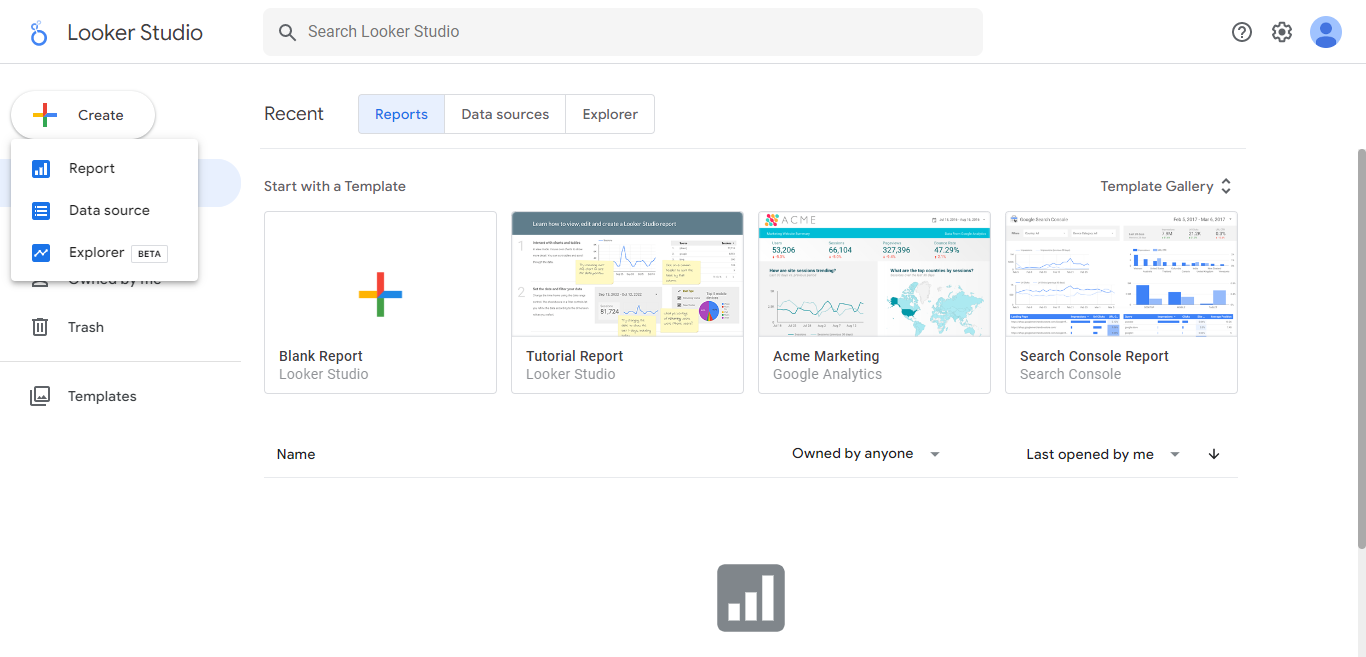
A new report will open, allowing you to select what data to add to the report.
If you need to create a new data source, go to the Connect to data tab, and follow the steps in the Add and Authorize Spoors EFFORT Data Connector in Looker Studio.
-
Under My data sources, you can see the data source files
you have already created with connectors. Select the one you'd like to use, and
click on the Add button in the bottom left corner.

-
Click Add To Report in the pop-up.

-
The new report will open, and you can start building your charts.
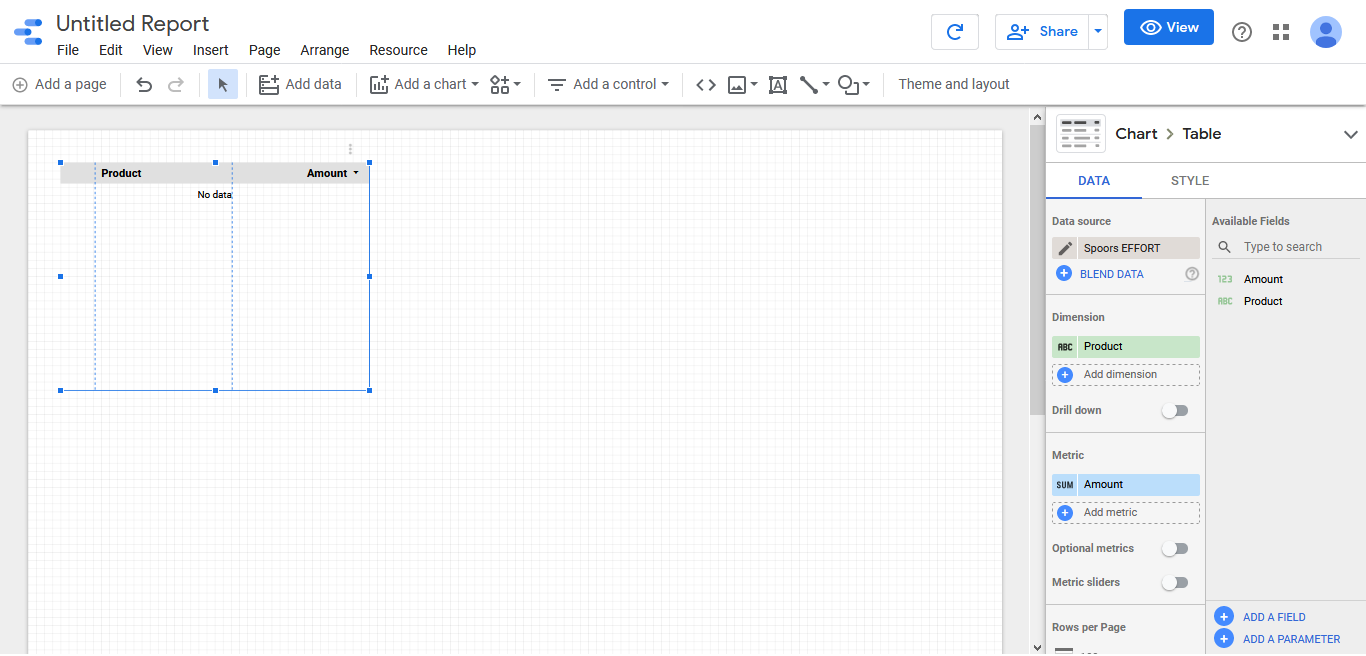
A table chart may be automatically created by Google Data Studio to a blank report. -
Add a new chart to the report by clicking on Add a chart in the top navigation
bar of the report.
A menu will open, showing you the available chart types. Pick which chart you'd like to use.